In this article, I’ll show Neon autoscaling in action by running a load test using one of Postgres’ most popular benchmarking tool, pgbench. The test simulates 30 clients running a heavy query.
While 30 doesn’t sound like a lot, the query involves a mathematical function with high computational overhead, which signals to the autoscaler-agent that it needs to allocate more resources to the VM.
We will not cover how autoscaling works, but for those interested in knowing the details, you can read more about how we implemented autoscaling in Neon.
For this load test, you will need:
The load test
Ensuring your production database can perform under varying loads is crucial. That’s why we implemented autoscaling to Neon, a feature that dynamically adjusts resources allocated to a database in real-time, based on its current workload.
However, the effectiveness and efficiency of autoscaling are often taken for granted without thorough testing. To showcase autoscaling in action, we turn to Postgres and pgbench.
pgbench is a benchmarking tool included with Postgres, designed to evaluate the performance of a Postgres server. The tool simulates client load on the server and runs tests to measure how the server handles concurrent data requests.
pgbench is executed from the command line, and its usage can vary widely depending on the specific tests or benchmarks being run. Here is the command we will use in our test:
pgbench -f test.sql -c 30 -T 120 -P 1 <CONNECTION_STRING>In this example, pgbench executes the query in test.sql. The parameter -c 30 specifies 30 client connections, and -T 120 runs the test for 120 seconds against your database. -P 1 specifies that pgbench should report the progress of the test every 1 second. The progress report typically includes the number of transactions completed so far and the number of transactions per second.
30 clients don’t seem like enough do stress a database. Well, it depends on the query you’re executing, which we’ll see next.
Query execution plan
Here is the query we’ll use for our load test:
SELECT log(factorial(32000)) / log(factorial(20000));Mathematically, this query essentially compares the growth rates of the factorials of 32,000 and 20,000 by examining the ratio of their logarithms.
Remember factorials? The factorial of a number n (denoted as n!) is the product of all positive integers less than or equal to n. For example, the factorial of 5 (5!) is 5 * 4 * 3 * 2 * 1 = 120. Factorials grow very rapidly with increasing numbers.
To give you a sense of scale, the factorial of just 20 is already a 19-digit number: 20!=2,432,902,008,176,640,000
The natural logarithmic function (log), on the other hand, is the power to which e (Euler’s number = 2.71828) must be raised to obtain the value x.
In other words, this operation should take a long time to process. How long? Let’s examine the query execution plan using EXPLAIN ANALYZE:
EXPLAIN ANALYZE SELECT log(factorial(32000)) / log(factorial(20000));Output:
QUERY PLAN

-------------------------------------------------------------------------------------

 Result  (cost=0.00..0.01 rows=1 width=32) (actual time=0.000..0.001 rows=1 loops=1)

 Planning Time: 1921.630 ms

 Execution Time: 0.005 ms

(3 rows)
This query was executed on ¼ vCPU. EXPLAIN ANALYZE includes the planner’s estimates and real execution metrics. Execution Time appears to be quite fast. However, Planning Time (the time taken by the Postgres query planner to generate the execution plan) takes almost 2 seconds and suggests that preparing to run this mathematical function involves significant computational overhead.
Combine 30 of those, and we should stress Postgres enough to trigger autoscaling.
Enabling autoscaling
Autoscaling is the process of automatically increasing or decreasing the CPU and memory allocated to a database based on its current load. It dynamically adjusts the compute resources allocated to a Neon compute instance in response to the current load, eliminating the need for manual intervention. Learn more about autoscaling in the docs.
You can enable autoscaling by defining the minimum and maximum compute units (CU) you’d like to allocate to your Postgres instance. This way, you remain in control of your resource consumption. For example, 1 CU allocates 1vCPU and 4GB of RAM to your instance.
You can set your instance size when you create a new project or by navigating to the Branches page on your Neon Console, clicking on the database branch, and setting the CU range.
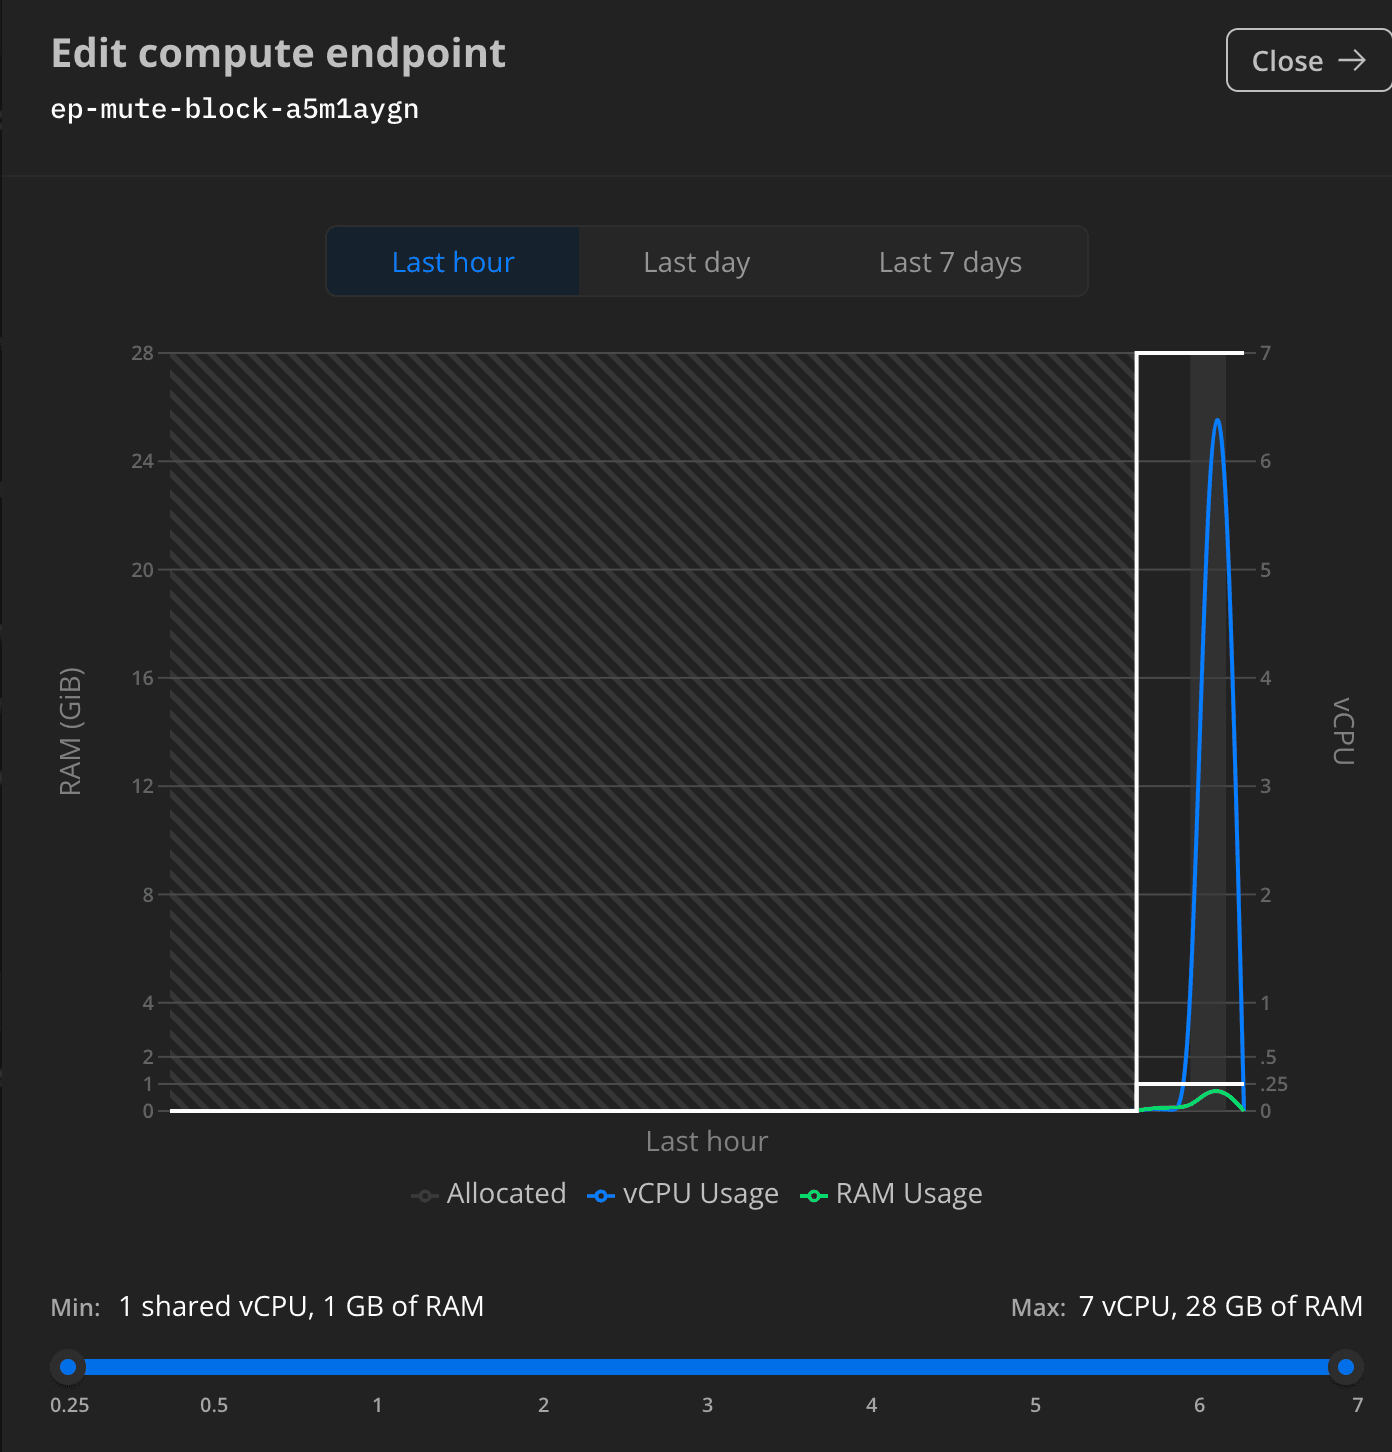
I will set the range for this load test from ¼ to 7 CUs.
Executing & monitoring the load test
Let’s run our load test now and observe its effect on our Postgres instance. We recently added graphs to monitor the resources allocated to your Postgres instance and its usage, which will come in handy later. After enabling autoscaling, follow these steps to execute the load test:
1. Create your project folder and test.sql file:
mkdir pgbench-load-test

cd pgbench-load-test

echo "SELECT log(factorial(32000)) / log(factorial(20000));" > test.sql
2. Execute the load test by running the following command:
pgbench -f test.sql -c 8 -T 120 -P 1 <YOUR_CONNECTION_STRING>you can create a Neon project if you don’t have a connection string.
3. Navigate to the autoscaling graph to monitor usage:
You should observe a rapid change in CPU and memory allocated. The result should look similar to the graph below.

The performance summary returned by pgbench should look like this:
latency average = 6000.891 ms
latency stddev = 2768.066 ms
initial connection time = 3712.770 ms
tps = 4.978907 (without initial connection time)
On average, each operation took slightly over 6 seconds to complete. A standard deviation of 2768.066 ms means that the latencies of individual operations varied quite a bit around the average latency. A higher standard deviation indicates more variability in how long each operation took to complete.
Establishing this connection took approximately 3.7 seconds before any operations could be performed. A TPS of around 4.98 means that, on average, the database was able to complete nearly five transactions every second during the test, after excluding the initial connection time.
Conclusion
pgbench is a simple yet powerful tool to test your database and simulate multiple clients running heavy SQL queries. We also saw how to examine the query execution plan with EXPLAIN ANALYZE, which provides insights to optimize your SQL queries.
If you’re running an application that can be subject to varying workloads, autoscaling offers you the confidence that your database will always under the stress of real-world demands.
Thanks for reading. If you are curious about autoscaling, give Neon a try and join our Discord. We look forward to seeing you there and hearing your feedback.
Happy scaling!


